

|
Check out our new audio content!
Getting your Trinity Audio player ready...
|
Image from Pixabay
By Dan Harkey
Real Estate & Finance Consultant
Definition of capitalization of earnings:
The concept of the capitalization approach is a method of estimating the fair value of an asset such as income-producing real estate by calculating the net present value (NPV) of expected future net profits or net cash flow referred to as Net Operating Income. The capitalization of earnings is determined by taking the property’s projected annual net income and dividing it by the market capitalization rate (Cap Rate).
Understanding the income capitalization approach (Cap Rates) in the property valuation process is critical when investing in income-producing real estate or obtaining a loan. This concept is essential to commercial realtors, lenders, developers, and investors in income-producing real property. The concept is commonly referred to as the income approach.
Net income divided by the capitalization rate will reflect the expected value of the income-producing asset. Re-stated: Net operating Income divided by the capitalization rate= value (NOI/Cap Rate=Value).
Example: Property Income and Expense Statement Format
The calculation to arrive at the Net Operating Income
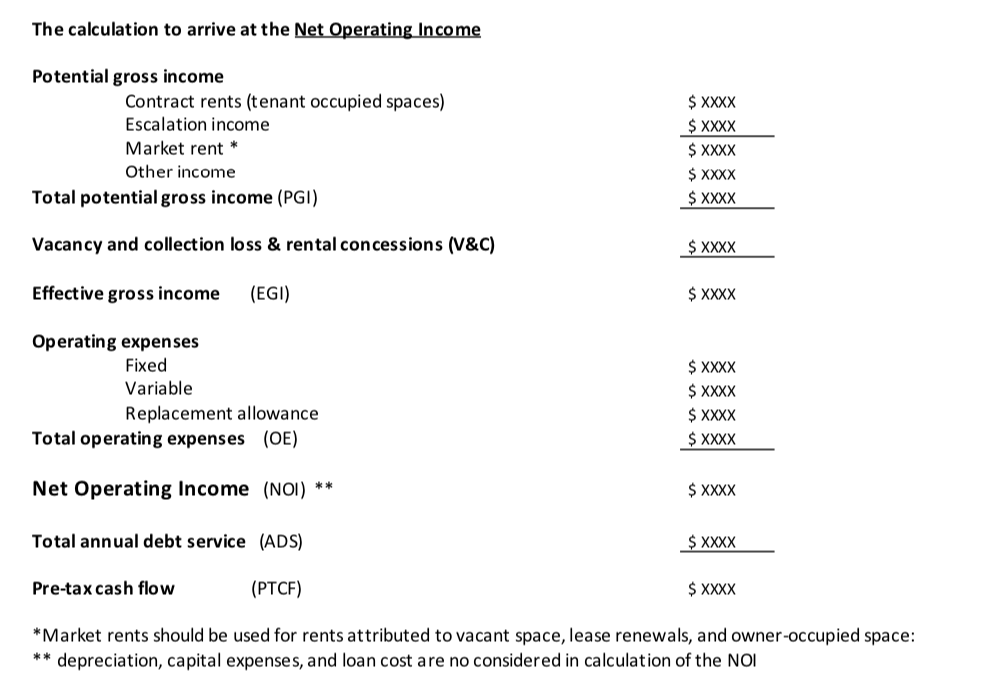
Stated one more time: Capitalization Rate represents the annual Net Operating Income (NOI) divided by the cap rate to derive the property asset value (NOI/Cap Rate= Value).
Why do we use Capitalization Rates?
The capitalization approach is a “comparative method” of valuing property with similar properties, similar income streams, in similar geographic locations, and similar risks that will yield a comparable rate-of-return. Once the value is established, the comparative method can calculate the loan-to-value to determine if property value falls within the lender’s loan underwriting guidelines.
Cap Rates are only one metric. Since the capitalization approach is calculated as if the property is debt-free the value will be the same whether the property has leveraged debt or is debt-free. It represents a market snapshot at the investment time and does not consider loan debt service or financing costs.
If an investor finances his acquisition, as most people do, further analysis such as cash-on-cash return will be helpful. Sophisticated loan underwriters and investors may also calculate an Internal Rate of Return. These calculations assist in establishing that the property is income-producing and a worthwhile investment.

Image from Pixabay
A licensed commercial appraiser may perform a rent survey to determine market rents for a property type in a geographic area. Market rents may or may not be the same as actual rents (contract rents). There are many instances where the existing rents are above or below-market rents. A tenant with a long-term lease may have locked in lower rents sometimes in the past.
I once underwrote a loan transaction on an industrial building near San Francisco that was about 100 years old. The property has a long-term lease of 18 cents per square foot, while the current market was $1.75 a square foot. Since current market rents were much higher, the valuation metric used was based upon the locked-in lower rental rate.
A property owner may own the property in one title method such as The Archie Bunker Corporation and occupy all or a portion of the building in different title method such as Archie Bunker Limited Liability Company. He may charge above or below-market rents to himself for tax purposes. Actual rents may also be higher than the market. In this case, the appraiser would use market rents rather than actual rents to determine the Cap Rate.
There are other instances where a conventional market Cap Rate analysis is inappropriate. The alternative method is a discounted cash flow analysis such as original ground-up construction. The building cost and the cash flow from a lease-up need to be projected over a reasonable time to the point of stabilized occupancy. This is done by a competent appraiser who can construct a model estimating a future projected cash flow and using net present value discount formulas to estimate the capitalization rate. The result may differ from the market comparison method.
Suppose you have income properties with similar characteristics in a geographically close location sold in arm’s length cash transactions, and the income stream data is available. In that case, there are web-based databases that track comparison capitalization rates (Cap Rates.)
Market rents are the amount of rent that can be expected for a property, compared to similar properties in the same geographic areas. Contract rent or actual current rent is what the same units are being rented for today. Many lenders will request a rental survey from an appraiser as an add-on task to the requested appraisal job.
There is an essential difference between market rents and current actual(contract) rents in the Cap Rate valuation process. Compare two different buildings, both identical, but the first property is well-kept and rented at a market rate, and a second building that has deferred maintenance. The property with deferred maintenance is rented for under-market rates by under 30%. In both cases, a lender and the appraiser will use market rents to determine the (NOI). The assumption about the second building is that a new owner will upgrade the building and adjust the rents upward to a market rate. The value of the second building would be adjusted downward or discounted to offset the cost to cure (cost to upgrade the building).
The only time that a lender, or appraiser, would use the lower rents is when those rates were locked into a long-term lease or a rent-controlled property. I underwrote the following example: A prospective loan for an industrial building in Richmond, California. The property was leased fee, leased out to a third party for 99 years, with 50 years remaining. The locked-in rent was only 18 cents per square foot triple net. The property owner and broker argued belligerently that current value should be based upon today’s rents.
An inconvenient fact in this example is that the property owner is locked into an 18 cent per square foot monthly income stream for the next 50 years. Capitalized rents will be based upon 18 cents per square foot lease rate. The capitalized value with an 18 cents per square foot will have a dramatically lower NOI compared to a similar building next door that rents at $1.75 per square foot lease rate monthly.

Image from Pixabay
A historic rents comparison databases are available to determine market rents to calculate a correct capitalized valuation. Historic market Cap rates may vary, even in the exact geographic location, depending upon the building improvements, effective age, class of construction, off-street parking, furnished or unfurnished, condition, compliance with zoning, easements or lack of needed easements, and amenities. Examples include Class-A vs. Class-C office, industrial, apartments, older dated, economically obsolete and under parked compared to a new modern building with adequate parking and currently popular amenities.
Advantages and disadvantages of the Capitalization approach to value:
Advantages:
- This method converts an income stream into an estimate of the value of the income-producing real estate.
- The method is a common standard in the appraisal, lending, and development business.
- While the income capitalization approach is common in evaluating commercial income-generating properties, it can theoretically be applied to any income stream, including businesses.
- Commercial appraisers are a reliable source for determining market cap rates.
- Commercial realtors provide an excellent source of cap rates with websites such as Costar and Crexi
- There are online databases such as the CBRE/US-Cap-Rate-Survey-Special-Report-2020 to obtain reliable data.
https://www.cbre.us/research-and-reports/US-Cap-Rate-Survey-Special-Report-2020
Disadvantages:
- The method is used for “comparison only with similar properties in a close geographic area.” The method does not consider liens on the property and debt service. A cap rate calculation is done as though the property is debt-free. Cap rates cannot be used to calculate overall net cash flow or cash-on-cash yield when a loan attached to the property (Income, less operating expenses, less debt service).
- The results of a cap rate calculation are specific only to a similar area with similar properties in certain segments of the market. You could no use Newport Beach, California cap rates to compare with a similar building with similar usage in Riverside, California. Also, the demand for properties and cap rates for different segments of the real estate market change. Current examples are residential income properties and Industrial are and will continue to be in demand. I read one estimate that industrial in the U.S. will require an extra billion square feet of warehouse by 2025. Office and lodging/resort related properties, not so will. Patterns change!
- The method contemplates stable economic market conditions. If a market experiences a significant downturn, collapses, or is subject to extreme political uncertainty, the calculations using market cap rates may be rendered irrelevant.
- Relying on a cap rate with an unstable market condition is difficult. Using market rents may become suspect because higher rates of foreclosures, tenants’ default much more frequently, vacancy rates go up, and replacement tenants will ask for higher rent concessions, thereby bringing the market rents down. Additionally, owner operating expenses may become constrained.
- Calculating forecasting future income streams involves a high degree of professional judgment, and therefore subject to variation.
- Professional judgment is subject to subjective vs. objective interpretations about expectations of future benefits.
- The method may result in miscalculations when estimating the cost of capital outlay for upgrades to bring the property up to current standards. All subsets of the job have a cost, time and frustration allocation, including municipal approvals, reconstructing the building, modern materials, safety, zoning, environmental, and social equity requirements.
- Property amenities, parking, easements, recorded encumbrances, and compliance with building and zoning regulations require a complex analysis.
- The lease-up period is only an estimate and may not be correct.
- Alleged appraiser and lender biases for racially segregated neighborhoods have been known to exist.
Tenancies: A landlord and tenant may enter into four types of rental or lease agreements. The type depends upon the agreed-upon terms and conditions of the tenancy. All rental amounts and terms of a lease will be reflected in the capitalization evaluation.
Types include:

Image from Pixabay
1) Fixed-term tenancy is a tenancy with a rental agreement that ends on a specific date. Fixed terms have a start date and an ending date. According to the written lease document, time terms may be short or long such as ten years with multiple extensions.
A landlord can’t raise rents or change lease terms because the terms are codified in a written agreement. A key advantage for a landlord is to receive today’s market rents.A key for a tenant is to lock in a long-term lease where the rents are or become below market over time.
A tenant’s company’s profits are enhanced if they pay substantial under market rents. On the other hand, if a tenant’s company is making a good profit with rents substantially below market and a lease is coming due soon, the increased or negotiated upward lease rate may wipe out some or all the profits.
2) Periodic tenancy is a tenancy that has a set ending date. The term automatically renews into successive periods until the tenant gives the landlord notification that he wants to end the tenancy. Month-to-month tenancies are the most common.
The strength of the tenancies from national credit with long-term leases and corporate guarantees down to mom & pops month-to-month tenancies will result in a substantially different Capitalization Rate. National credit tenants with corporate guarantees have a considerably lower cap rate. Mom & pop tenancies will reflect a higher cap rate because they inherently have more risk.
The lower the market Cap Rate, the lower the perceived risks of property ownership. The higher the market Cap Rate, the higher the perceived risks. An exception would be where the national credit tenant locks in a lease rate that does not increase as the market dictates or anticipates increases. Eventually, over time, this tenant will reflect below-market rents.
A mom-and-pop tenant could be converted to a market rent more quickly because the term is usually shorter.
Market rents are obtained by surveying local brokers and appraisal data- bases of local market rents.
3) Tenancy-at-sufferance (or holdover tenancy). This form of tenancy is created when a tenant wrongfully holds over past the end of the duration of period of the tenancy.
I bring up this type of tenancy because of because of COVID. The government allowed tenants to skip out and default on paying rents without consequence. The tenants either defaulted on the rent or overstayed the term.In either event, the tenant becomes delinquent, and the owner attempts to evict them. The tenant or affiliates may become illegal trespassers.
There are many examples of a landlord attempting to get rid of an illegal tenant only to be jerked around through the court system, with multiple appeals requested by the tenant. They are usually granted.Then comes multiple bankruptcies, not only of each tenant, one by one, but unknown people who supposedly moved in without notice to the landlord.Then comes the transients and fictious folks who show declare that they are a tenant and request that the process start all over because of their fraudulently claimed tenancy. The courts, particularly in states like California just turn their backs on this behavior.
The focus for the property owner becomes using legal avenues to evict the tenants and regain occupancy of the property. This process has great cost and frustration.
4) Tenancy-at-Will. This form of tenancy reflects an informal agreement between the tenant and landlord. The landlord gives permission, but the period of occupancy is unspecified. The term will continue until one of the parties give notice.
Rehabilitated property or New Construction:

Image from Pixabay
Establishing market rents becomes essential in underwriting a rehabbed or new building. When there is an extended time delay for a lease-up period, such as with the new construction of an income-producing property, future cash flows need to be estimated to the point of income stabilization. Then the future stabilized income will be discounted, using an estimate of a market capitalization rate and a discount rate formula.
Work with a competent commercial appraiser to assist and calculate the correct market Cap Rate. Do not try to do this yourself without the help of an appraiser who knows the type of real estate and local market.
Below is an example: The market Cap Rate for a commercial property with triple net leases (NNN) has been determined to be 6.5%. Triple Net or (NNN) refers to a leased or rented property where the tenant pays all expenses related to the operation such as taxes, insurance, maintenance, and occasional capital improvements. The 10,000 square foot multi-tenant property under consideration generates monthly rents of $1.50 per foot. On a (NNN) example for a Cap Rate analysis, one would apply a 10% vacancy collection and loss factor and 5% for non-chargeable expenses that tenants usually do not pay including reserves. The NOI would be $153,900.
The NOI and Market Cap Rate are known so you can calculate the value:
10,000 SF rentable X $1.50 = $15,000 Per mo. X 12 Mos. = $180,000 = potential gross income.
$180,000–$18,000 for 10% vacancy = $162,000–$8,100 for 5% non-chargeable expenses to the tenants = NOI = $153,900
$153,900 NOI /.065 Cap Rate = value = $2,367,692
From an investment standpoint, market Cap Rates can show a prevailing rate of return at a time before debt service. The cap rate procedure will assist a lender and investor to measure both returns on invested capital and profitability based on cash flow. An informed lender or investor should understand that there may be dramatic variations in a property’s value when unsupported or unrealistic Cap Rates are applied.
Cap Rates as well as demand for income-producing properties will move up or down depending on market conditions. The term Cap Rate compression reflects a movement of the rate down because investors perceive real estate as a lower-risk, higher reward asset class relative to other investment options. Cap Rate decompression may result from demand for real estate purchases where cap rates increase, reflecting lower valuations. This may be a byproduct of higher interest rates or government intervention such as rent control.
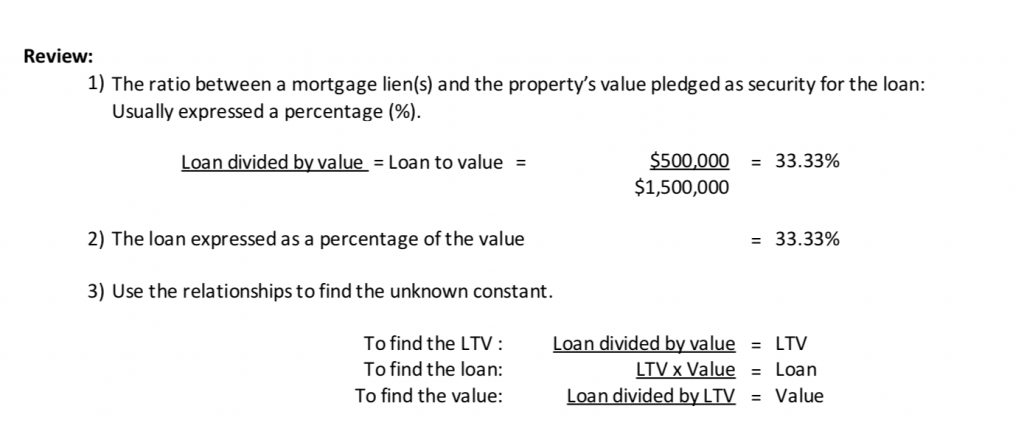
Loan-To-Value Ratio (LTV):
Cash-on-Cash Return:
Cash on cash return is a quick analysis to determine the yield of an initial investment. The cash-on-cash return is developed by dividing the total cash invested (the down payment plus initial cost) or the net equity into the annual pre-tax net cash flow.

Image from Pixabay
Assume the borrower purchased the property, which costs $1,200,000 and provides an NOI of $100,000, with a $400,000 down payment representing the equity investment in the project. The cash-on-cash return for this property would be:
$100,000/$400,000 = 25% = cash-on-cash yield.
If the borrower were to purchase the property for all cash, as contemplated in a Cap Rate calculation, then the cash-on-cash return would be:
$100,000/$1,200,000 = 8% (this example the 8% is both the cash-on-cash yield and Cap Rate).
It is clear from this formula that leveraging or financing real estate transactions will yield a higher cash-on-cash return, provided the transaction is financed at a favorable interest rate.
Internal Rate of Return (IRR):
Internal rate of return (IRR) refers to the yield that is earned or expected to be earned for an investment over the period of ownership. IRR for an investment is the yield rate that equates the present value of the outlay of capital and future dollar benefits to the amount of money invested. IRR applies to all dollar benefits, including the outlay of the initial down payment plus cost, the positive monthly and yearly net cash flow, and positive net proceeds from a sale at the termination of the investment. IRR is used to measure the return on any capital investment before or after income taxes. Ideally, the IRR should exceed the cost of capital.
Is there an ideal Cap Rate?
Each investor should determine their risk tolerance to reflect their portfolio’s ideal risk-reward level. A lower Cap Rate means a higher property value. A lower Cap Rate would imply that the underlying property is more valuable, but it may take longer to recapture the investment. If investing for the long-term, one might select properties with lower Cap Rates. If investing for cash flow, look for a property with a higher Cap Rate. Declining Cap Rates may mean that the market for your property type is heating up, and demand is intensifying. For Cap Rates to remain constant on any investment, the rate of asset appreciation and the increase of NOI it produces will occur in tandem and at the same rate.
Below are examples of changes in NOI and Cap Rates that cause asset values to rise or to go down:
As NOI increases and Cap Rates remain the same, asset values will increase.
($300,000 reflects net operating income and .06 reflects a 6% cap rate)
$300,000 /.06 = $5,000,000
$350,000 /.06 = $5,833,000
$400,000 /.06 = $6,666,666
$450,000 /.06 = $7,500,000
As NOI remains the same and cap rates rise asset value will go down:
($500,000 reflects net operating income and .03 reflects a 3% cap rate)
$500,000 /.03 = $16,666,666
$500,000 /.04 = $12,500,000
$500,000 /.05 = $10,000,000
$500,000 /.06 = $8,333,333
Correlation Between Cap Rates and US Treasuries:
The US Ten Year Treasury Note (UST) is deemed to be the risk-free investment against which returns on other types of investments can be measured. USTs yields have been on a broad decline for many years but may soon rise. As interest rates increase those investors who bought USTs at a lower rate will find that their bonds will go down in value. Bonds purchased at the new higher rates will be in high demand.

Image from Pixabay
As interest rates rise, cap rates will go up, and consequently, there will be a reduction in asset values over time. With so many uncertainties in the market and growth projections constantly being revised, the spread between UST and Cap Rates has not remained constant.
When the government intrudes in the market, the results are artificial. This has caused capitalization rates to go down, reflecting higher values. Near-zero interest rates have also caused a dramatic inflationary spike in all goods and services.
Summary:
Property appreciation from excess demand has been one of the most significant reasons for investing in real estate Appreciation is not part of the Cap Rate calculation. For investors, lower interest rates, tax benefits of owning commercial real estate may, in and of themselves, be the driving force to make such an investment. If the property is to be leveraged, there may be write-offs for loan fees, interest expenses, operating expenses, depreciation, and capital expenses.
As interest rates have been forced down to extremely low rates, below inflation, by government mandate! Refinancing at lower rates has resulted in lower debt service payments. Cash flows of income-producing properties have gone up, reflecting a higher net operating income.
The government intentionally creates market distortions that benefit the insiders at the top of the economic spectrum. The results are artificial. This has caused capitalization rates to go down, reflecting higher values. Near-zero interest rates have also caused a dramatic inflationary spike in all goods and services. All asset classes have now been “spiked with 200-proof illusions” that make everything seem fantastic on the surface. But hangovers the day after the party ends are no fun.
A one-to-two hundred basis points increase in lending rates (1% to 2%) would shatter the punch bowl into fragments. It is my opinion that an imediate 2% interest increase would collapse the economy overnight. Main Street and small capitalist entrepreneurs would bear the brunt of the widely spread financial damage.
Interest rates are increasing because the government realizes that inflation will only accelerate if they do not stop or slow it. Increased interest rates will result in newly originated loans having higher payment structures. Higher loan payments indirectly and over time cause cap rates to rise and values to go down.
Values may not go down immediately, but the demand to purchase income- producing properties will subside because ownership makes less economic sense. To add flames to this fire government, including federal and state, is passing legislation that will destroy investor motivation to own.
Over time the four-pronged whammy will become apparent. 1) Rising interest rates, 2) increase in interest rates reflecting larger loan payments, 3) general loss of investor confidence in the overall economy, 3) loss of investor interest in purchasing an income property, 4) overburdening & abusive government intervention into property ownership will come home to haunt the entire real estate market across the United States. 5) All of the above will cause cap rates to go up, and property values go down.

Image from Pixabay
Remember that increased debt service based upon higher interest rates is not considered in the capitalization approach. But, over time, as interest rates go up, borrowers will feel the sting of higher debt service payments. Some property transactions may become less appealing financially. As purchasers and borrowers elect not to purchase, that may compound and create more unsold inventory. Some sellers may get desperate and reduce the price to sell quickly. The lowered price would result in a higher cap rate. Higher interest rates will lower all real estate prices on a macro level.
How dramatic will lower real estate prices be over time? Between 2007 and 2010 we witnessed the downward value contagion spread resulting in substantially lower values and increased Capitalization Rates.
The four-pronged whammy is not a new phenomenon. It has just been forgotten while enjoying the Federal Reserve’s “free-for-all 200-proof infused financial punchbowl.”
Dan Harkey
Dan is President and CEO at California Commercial Advisers, Inc. He consults on subjects of Business Growth & Private Money. Dan often creates articles interrelated to these subjects. He has been active in the real estate and financial services industry since 1972 & possesses a lifetime teaching credential for secondary and adult education. He has taught over 350 educational seminars on subjects related to real estate lending, private money lending & loan underwriting for commercial/industrial properties.
Contact Dan Today
Mobile: 949.533.8315
Email: [email protected]
Learn live and in real-time with Realty411. Be sure to register for our next virtual and in-person events. For all the details, please visit Realty411.com or our Eventbrite landing page, CLICK HERE.


