|
Check out our new audio content!
Getting your Trinity Audio player ready...
|
By Rick Tobin
A blended rate is a combination of interest rates on multiple loans for an individual or household and calculated as if they were just one rate.
Those very fortunate mortgage borrowers with existing 1st mortgage rates at or below 3% or 4% might be hesitant to choose a new cash-out refinance 1st loan to pay off their rising unpaid consumer debts that may vary between 10% and 30%+ each.
More than 40% of all U.S. mortgage borrowers funded their purchase or refinance loan in either 2020 or 2021 when rates were at or near historical lows, according to data published by Black Knight. Many homeowners don’t want to lose their record low rate by refinancing the mortgage debt or selling, which is akin to a lock-in effect.
article continues after advertisement

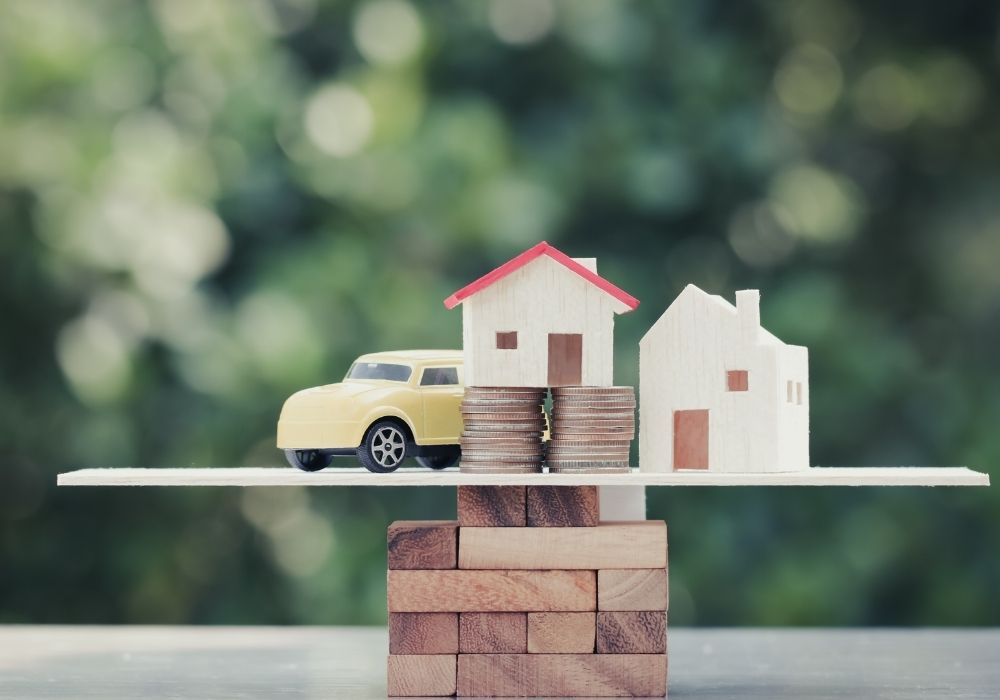
A blended rate analysis for an existing debt comparison to a new cash-out 1st or 2nd mortgage or HELOC (Home Equity Line of Credit) can be simplified by comparing the existing monthly debt obligations for the consumer with a proposed new cash-out mortgage or HELOC that pays off all of the existing mortgage and/or non-mortgage debt.
For example, the Jacksons have a $400,000 1st mortgage that has a 3% fixed rate for 30 years. They funded the loan near the all-time record low time period in early 2021 and now have just under 28 years remaining on the loan.
The Jacksons also have $50,000 in credit card debt that’s compounding at close to 30% and two used car loans which combine for another $50,000 that average near 12%. To simplify this calculation, I used the exact same balances for an easier interest rate calculation estimate of 21% (30% + 12% = 42% / 2 = 21%).
Let’s now add the $400,000 mortgage at 3% to the $100,000 in credit card and automobile loan debt at 21% for a grand total of $500,000. Four-fifths ($400,000) of the Jacksons’ monthly debt is at 3% while one-fifth ($100,000) is at 21%.
● $400,000 mortgage balance: 3% rate
● $50,000 credit card balances: 30% rate
● $50,000 automobile loan balances: 12% rate
● New blended interest rate for all debt: 6.6%
The Jacksons’ blended interest rate in this example is 6.6% for all of their monthly consumer debt when including their mortgage, credit card, and car payments.
The Jacksons explore their HELOC (Home Equity Line of Credit) options that would be recorded in second position behind their existing 3% fixed rate 30-year mortgage that they don’t want to lose.
As of October 18, 2023, the current average HELOC interest rate was 9.02 percent, as per Bankrate (all rates and fees are subject to change). Rates, fees, and APRs (Annual Percentage Rate) are all over the place, depending upon the lender, borrower’s creditworthiness, and daily financial market trends that may rise or fall.
With this HELOC rate estimate provided, we will explore both a 9% and 10% HELOC rate to get the Jacksons $100,000 to pay off their 30% credit card and 12% automobile loan rates.
● $400,000 mortgage balance: 3% rate
● A new $100,000 HELOC: 9% rate
● New blended interest rate for all debt: 4.2%
● $400,000 mortgage balance: 3% rate
● A new $100,000 HELOC: 10% rate
● New blended interest rate for all debt: 4.4%
Either way, a new HELOC that’s used to pay off consumer debt may decrease the total monthly blended rate for all monthly debt by at least 2% (6.6% blended rate – 4.2% or 4.4% blended rate = 2.4% to 2.2% blended rate improvement).
article continues after advertisement

My best HELOC programs (10-year interest only, 20-year amortizing) may be interest-only for the first 10 years while later adjusting to fully amortizing with principal and interest for a total loan term of 30 years. If I calculate these HELOC rates as interest-only for the first 10 years, the total blended rate payments would actually be even better.
To check your actual current blended rate debt as well as your potential future blended rate if you welcome a new HELOC loan, please enter your own consumer debt data (loan amount, rate, and number of individual loans) here to find out: Blended Rate Calculator.
The average borrower is in their home for about seven years, not 30 years. This is also about the average time period that a borrower holds one or two mortgage loans on their property before they later sell or refinance at a hopefully lower rate.
Snowballing or Compounding Credit Card Debt Examples
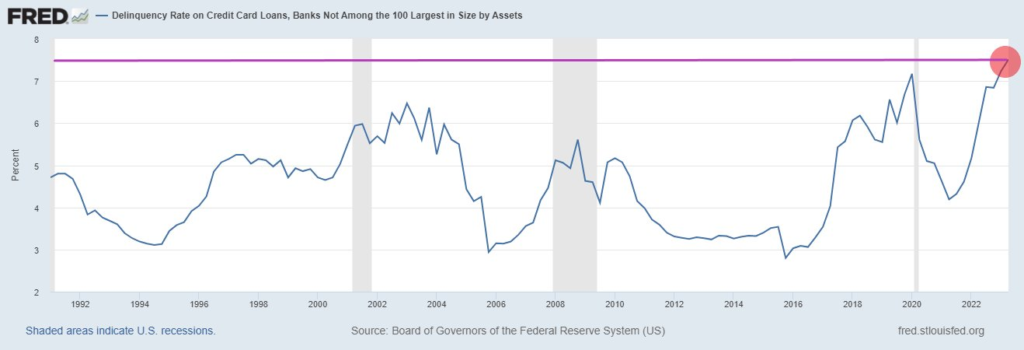
Credit card delinquency rates at small banks reached 7.51%, the highest level ever recorded according to the St. Louis Fed.
Average credit card rates surpassed 28% nationwide recently. However, retail store credit cards are now closer to 30%. By comparison, credit card rates averaged closer to 12% back in 2008.
In the 3rd quarter of 2023, new credit card delinquencies reached 7.2% according to the New York Fed Consumer Credit Panel and Equifax.
The average annual percentage rate (APR) for merchant cards, which many holiday shoppers will be using online or at nearby shopping malls, just hit 28.93%. This is a new all-time record, up from 26.72% in 2022, according to Bankrate.
Credit Card Debt Payoff Examples

Now, let’s compare how much time and interest is required to pay off a credit card debt balance of $20,000.
Many credit card issuers may have different minimum payment allowances which may vary from a minimal fixed dollar amount up to the interest plus 1% of the unpaid principal balance that’s paid monthly.
For example, let’s start with minimum payment example #1 that includes just interest-only with no principal paydown each month:
Credit card payment #1:
Unpaid credit card balance: $20,000
Interest rate: 28.93%
Annual interest paid for one year: $5,786 ($20,000 x 28.93%)
Monthly interest-only payments: $482.17 ($5,786/12 months)
If the borrower just pays the absolute minimum interest-only payment of $482.17 per month, it will take 41 years and 7 months to pay off the unpaid balance. If so, this is 11 years and 7 months longer than a brand new 30-year fixed rate mortgage.
The total interest paid by the borrower over this time period would be $220,496.44 (11 times the original $20,000 balance). To verify yourself, here’s the specific credit card payment example #1 link on Calculator.net.
Credit card payment #2:
Unpaid credit card balance: $20,000
Interest rate: 28.93%
Payment option: Interest + 1% of principal balance
Annual interest paid for one year: $5,786 ($20,000 x 28.93%)
Monthly interest-only payments: $482.17 ($5,786/12 months)
Payment of an extra $200 in principal ($20,000 x 1% = $200)
Total minimum monthly payment (interest + 1% of principal): $682.17
The payment of the absolute minimum interest-only ($482.17/month) plus 1% of the original $20,000 unpaid principal amount ($200 in principal) for a grand total of $682.17 per month will take 4 years and 4 months to pay off the entire balance in full. The total interest paid will be $15,134.49. To confirm yourself, here’s the specific link for credit card payment example #2 on Calculator.net.
Student Loan Debt
U.S. student loan balance: $1.8 trillion (fourth quarter of 2023)
Just 500,000 borrowers out of 43.5 million student loan borrowers, a 1.15% payment rate, were paying on time prior to the October 1, 2023 payment restart date. Many of these average $500+ per month student loans are adjustable and are likely to increase over time, sadly.
The average federal student loan debt is $37,338 per borrower. Private student loan debt averages $54,921 per borrower. Twenty years after entering school, 50% of the student loan borrowers still owe more than $20,000 each on outstanding loan balances, according to the Education Data Initiative (May 22, 2023).
Just 90 days after the October 1, 2023 student loan payment restart date, any ongoing delinquent student loan payments may be shared with the credit bureaus as early as January 1, 2024. If so, the FICO credit scores for delinquent student loan borrowers may begin to fall as their borrowing costs for future loans may rise as well.
Worsening Automobile Loan Sector

In September 2023, Fitch Ratings reported that 6.11% of automobile loan borrowers were at least 60 days late on their payments. This is the highest delinquency rate since the early 1990s.
While a 30-day late can often be a mistake by a borrower who forgot about their payment, a 60-day later indicates possible significant financial challenges. Few people want their car repossessed, so it’s usually a top priority monthly debt obligation that a borrower will focus on to get paid each month. Without a car, how does someone get to school, work, or to visit friends and family if they don’t have access to affordable and convenient public transportation nearby?
- Average subprime car loan rates are reaching the 17% – 22% loan rate range.
- The percentage of subprime auto borrowers who are 60+ days past due on loans hit an all-time record high of 6.1% in September (#2 highest: 1994 – 6.0%; and #3 highest: 2008: 5.0%).
- The average new car price is now higher than $48,000.
- Average new car payment rates are near $750/month and the average student loan payment is just over $500/month. For consumers with both forms of debt, they are paying close to $1,250 per month for just their car and student loan while not counting insurance, gasoline, or maintenance for the car.
- The average used car price now is $30,700 as compared with an average used car price just under $8,000 back in 2008.
- The average loan-to-value ratio for a used car is 125% LTV (no money down + taxes, license, registration, warranty, other fees, and declining value over time).
- There are now 20,000 car repossessions PER DAY (600,000 per month) while rising exponentially each consecutive month. If the same pace of rising and compounding car repos continues onward, there might be upwards of one million car repos PER MONTH in 2024 (yes, one million per month).
There are approximately 100 million car loans across our nation. However, there are an estimated 276 million automobiles nationwide, so the car loan-to-total cars nationwide ratio is just over 36% (100 million/276 million = 36.23%).
Moody’s recently warned about potential automobile loan and credit card default rates as high as 9% to 10% in 2024. If so, this might be equivalent to nine to 10 million car loan defaults or repos out of the total 100 million car loans. If proven true, a nine to 10 million car loan default rate would make the one million car repossession projection for 2024 seem much too conservative and only a fraction of how bad the car delinquency numbers may reach.
California Mortgages: 50-Year Analysis
Between April 1971 and September 2022, the average 30-year fixed mortgage rate was 7.76%. Today’s 30-year fixed rates for consumers are fairly close to this historical 50-year average, depending upon their creditworthiness and whether it’s a conventional, FHA, VA, or non-QM type of loan.
The 30-year fixed rate peaked near 18.6% in October 1981. In January 2022, some 30-year fixed rates temporarily reached the high 1% to low 2% rate range.

Over the past 50 years, the typical California homebuyer spent 43% of their income on house payments. Today, the average homeowner spends closer to 58% to 65%+ of their monthly gross income on mortgage payments (principal, interest, taxes, insurance, and HOA, if applicable). After paying state and federal income taxes, many California homeowners are more likely paying closer to 70% to 80% of their net monthly income towards their monthly housing debt.
The median price of a California home over the past 50 years was $331,000. In September 2023, the median statewide price reached $843,340, according to the California Association of Realtors. This is almost more than double the median national home sales price that hit $431,000, as per the St. Louis Fed.
Over the past 50 years, the average monthly mortgage payment was $1,627 at 80% LTV with 20% cash down. In 2022, the average mortgage payment reached $4,043/month, a 148% increase.
In the fourth quarter of 2023, let’s review a potential new mortgage payment for a median home price in California that’s near $840,000:
Down payment percentage amount: 20% down payment (average is 6% down nationwide)
Down payment dollar amount: $168,000
New loan amount (80% LTV): $672,000
30-year fixed mortgage rate: 8% (example only, subject to change)
Monthly mortgage payment: $4,930.90 (principal and interest)

This example above does not include any monthly property taxes, insurance, or homeowners association (HOA) payments, if applicable.
The average household income for Californians over the past 50 years was $45,700. Today, the average income is closer to $84,000. This 84% increase in income isn’t enough to cover the 148% increase in mortgage payments, sadly.
A 20% down payment over the past half century for Californians was $66,000. In 2023, the average down payment increased to $168,000, which is a whopping $102,000 down payment increase.
Finding more affordable monthly blended rate payment options are what you should focus on these days as we all see consumer debt balances and interest rates either heading towards or surpassing all-time historic highs.
Please contact me today for a FREE blended rate analysis of your personal debt. You may be pleasantly surprised to learn how I can help reduce your overall blended rate, monthly payments, and possibly eliminate years or decades’ worth of extra debt payments.

Rick Tobin
Rick Tobin has worked in the real estate, financial, investment, and writing fields for the past 30+ years. He’s held eight (8) different real estate, securities, and mortgage brokerage licenses to date and is a graduate of the University of Southern California. He provides creative residential and commercial mortgage solutions for clients across the nation. He’s also written college textbooks and real estate licensing courses in most states for the two largest real estate publishers in the nation; the oldest real estate school in California; and the first online real estate school in California. Please visit his website at Realloans.com for financing options and his new investment group at So-Cal Real Estate Investors for more details.
Learn live and in real-time with Realty411. Be sure to register for our next virtual and in-person events. For all the details, please visit Realty411.com or our Eventbrite landing page, CLICK HERE.


